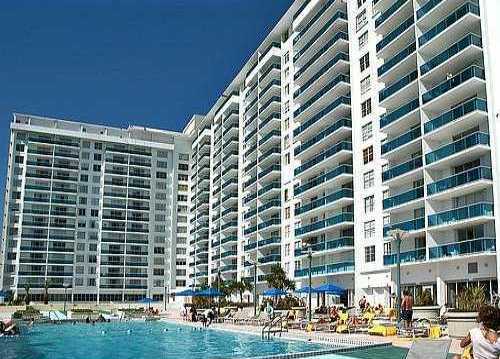
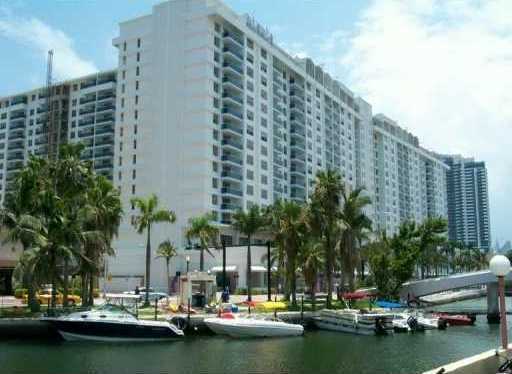
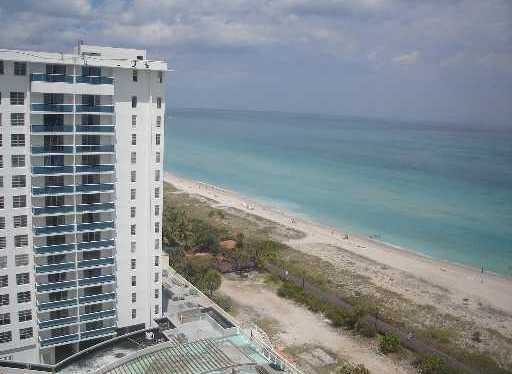
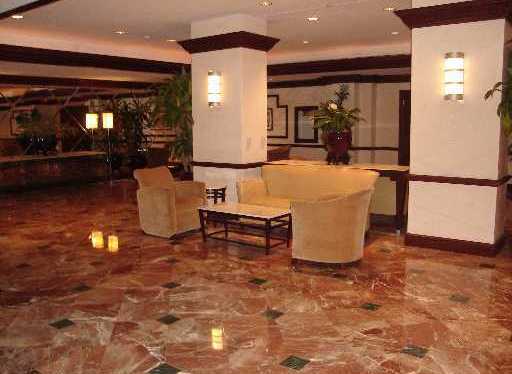
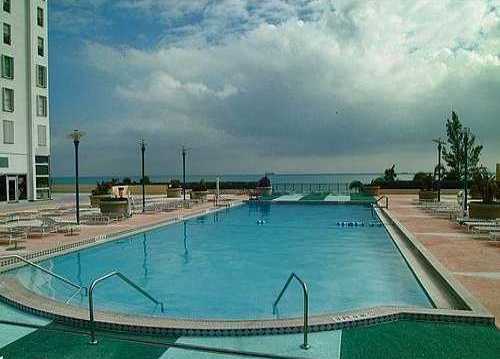
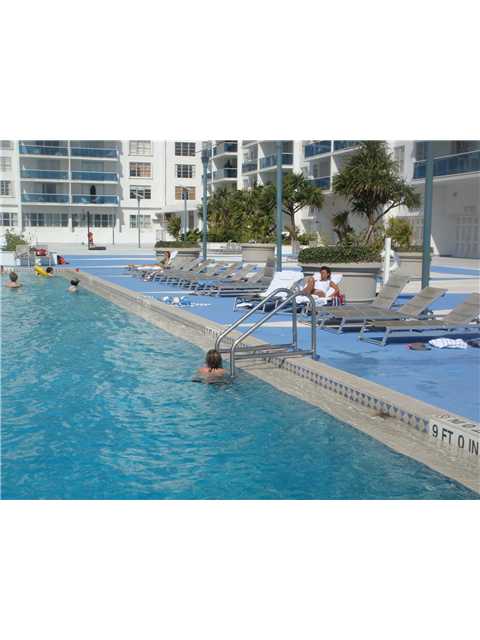
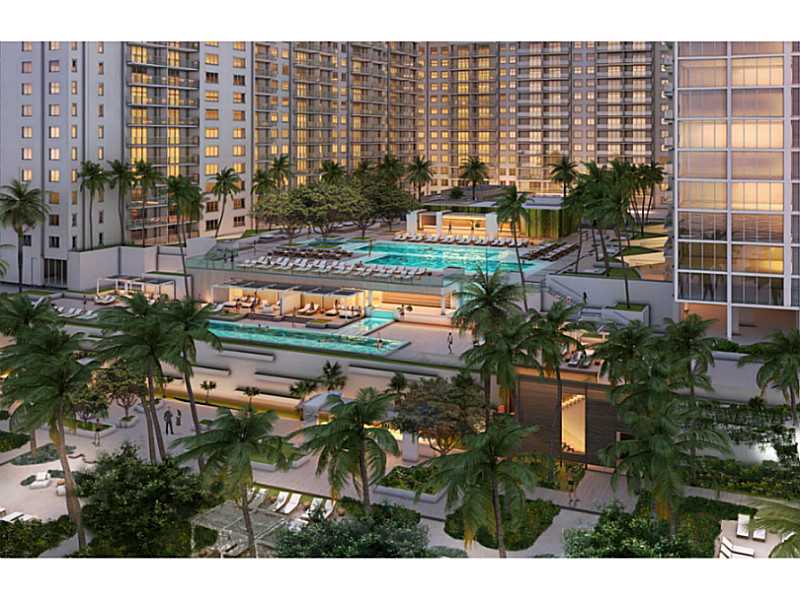
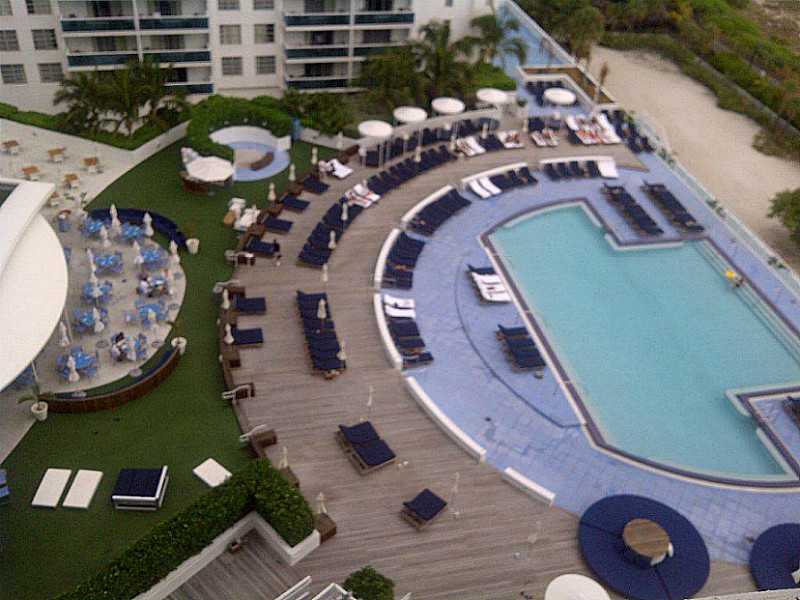
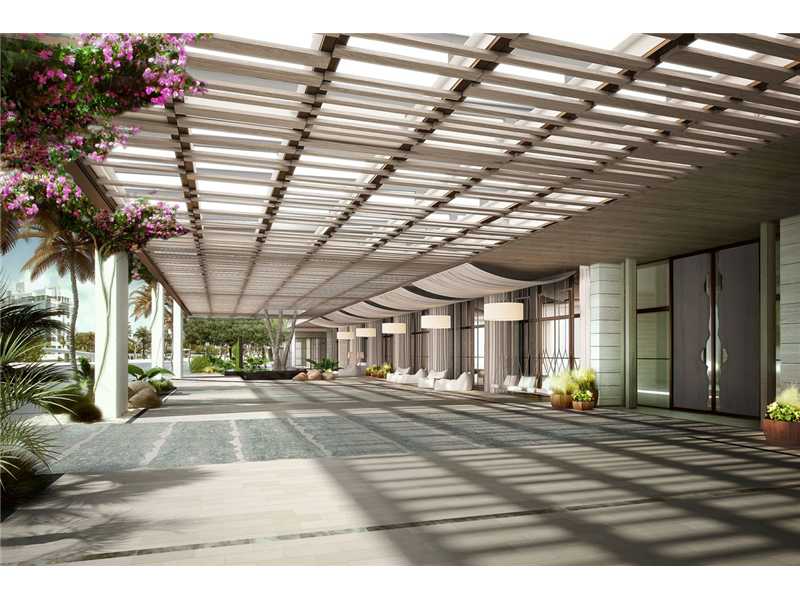
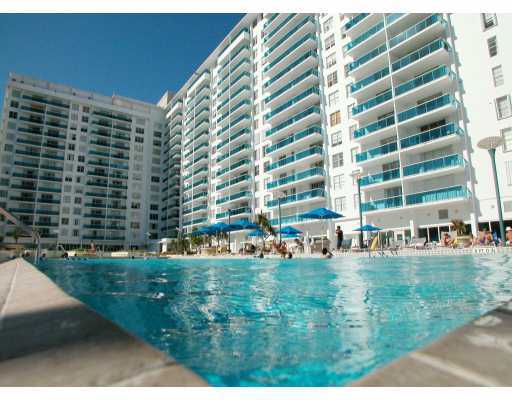
Roney Palace
2301 Collins Ave Miami Beach, FL 33139


Year Built
1926
Bedrooms
0 to 3
Square Ft. Range*
600 to 2,480
No. of Floors
17
No. of Units
480
Price Range*
$630,000 to $3,990,000
Available Units*
42
Avg $/Square Ft.*
$1,504
Average Price*
$1,499,702
Average DOM*
234
*Last Updated : 06/09/2026
Alerts on new Listings
Subscribe to new listing alerts and get a daily emails. On New Sales & Rentals
Roney Palace Condos For Sale
Studios Bedroom Condos for Sale
| Unit # | Price | %Chng | Img | Bed/Bath | Square Feet | Square m2 | Maint/$ |
|---|---|---|---|---|---|---|---|
| 543 | $630,000 | 31 | 0/1 | 660 | 61 | $1,408 | |
| 423 | $690,000 | 37 | 0/1 | 660 | 61 | $1,570 | |
| 1030 | $749,000 | -9.76% | 33 | 0/1 | 600 | 56 | $1,382 |
| 1512 | $760,000 | 52 | 0/1 | 760 | 71 | $1,627 | |
| 427 | $769,000 | -2.66% | 25 | 0/1 | 760 | 71 | $1,538 |
| 735 | $799,000 | 10 | 0/1 | 760 | 71 | $1,400 | |
| 1531 | $850,000 | 25 | 0/1 | 760 | 71 | $1,562 | |
| 736 | $860,000 | 15 | 0/1 | 760 | 71 | $1,400 | |
| 432 | $870,000 | -3.33% | 18 | 0/1 | 760 | 71 | $1,628 |
| 1130 | $875,000 | 29 | 0/1 | 600 | 56 | $1,382 | |
| 1632 | $900,000 | 28 | 0/1 | 760 | 71 | $1,628 | |
| 1532 | $900,000 | 5.88% | 28 | 0/1 | 760 | 71 | $1,561 |
| 836 | $900,000 | 29 | 0/1 | 760 | 71 | $1,299 | |
| 611 | $1,150,000 | 38 | 0/1 | 600 | 56 | $1,252 |
| # of Units | Avg Price | Avg $/SQFT | Lowest Sale Price | Highest Sale Price | Avg Days on Market |
|---|---|---|---|---|---|
| 14 | $835,857 | $1,188 | $630,000 | $1,150,000 | 221 |
 Short Sale
 - Foreclosure
*a blinking %change means price adjustment in the past 20 days.
New listing
Last updated Today
- Foreclosure
*a blinking %change means price adjustment in the past 20 days.
New listing
Last updated Today
1 Bedroom Condos for Sale
| Unit # | Price | %Chng | Img | Bed/Bath | Square Feet | Square m2 | Maint/$ |
|---|---|---|---|---|---|---|---|
| 931 | $699,000 | -4.12% | 27 | 1/1 | 760 | 71 | $1,627 |
| 731 | $750,000 | -11.76% | 31 | 1/1 | 760 | 71 | $1,627 |
| 636 | $845,000 | 37 | 1/2 | 760 | 71 | $1,561 | |
| 311 | $849,500 | 33 | 1/1 | 600 | 56 | $1,382 | |
| 325 | $980,000 | -19.34% | 41 | 1/1 | 850 | 79 | $1,548 |
| 404 | $1,125,000 | 28 | 1/1 | 880 | 82 | $1,929 | |
| 504 | $1,210,000 | 40 | 1/1 | 880 | 82 | $1,761 | |
| 303 | $1,250,000 | 19 | 1/2 | 960 | 89 | $2,113 | |
| 802 | $1,299,000 | -3.78% | 12 | 1/1 | 880 | 82 | $2,059 |
| 401 | $1,300,000 | -7.08% | 25 | 1/1 | 900 | 84 | $2,003 |
| 1204 | $1,425,000 | -4.94% | 34 | 1/1 | 880 | 82 | $2,059 |
| 1515 | $1,595,000 | -8.86% | 25 | 1/1 | 880 | 82 | $1,850 |
| 1633 | $1,675,000 | 15 | 1/1 | 960 | 89 | $1,960 | |
| 719 | $1,690,000 | 18 | 1/1 | 900 | 84 | $2,003 | |
| 1505 | $1,695,000 | 29 | 1/2 | 960 | 89 | $0 |
| # of Units | Avg Price | Avg $/SQFT | Lowest Sale Price | Highest Sale Price | Avg Days on Market |
|---|---|---|---|---|---|
| 15 | $1,225,833 | $1,419 | $699,000 | $1,695,000 | 199 |
Short Sale
- Foreclosure
*a blinking %change means price adjustment in the past 20 days.
New listing
Last updated Today
2 Bedroom Condos for Sale
| Unit # | Price | %Chng | Img | Bed/Bath | Square Feet | Square m2 | Maint/$ |
|---|---|---|---|---|---|---|---|
| 326 | $1,600,000 | -5.88% | 56 | 2/2 | 1,180 | 110 | $2,385 |
| 1041/42 | $1,999,000 | 29 | 2/2 | 1,260 | 117 | $3,088 | |
| PH-22 | $1,999,990 | -2.44% | 53 | 2/2 | 1,230 | 114 | $2,531 |
| 837 | $2,150,000 | 37 | 2/2 | 960 | 89 | $2,126 | |
| 1626 | $2,200,000 | -4.35% | 17 | 2/2 | 1,180 | 110 | $2,065 |
| 1006 | $2,290,000 | 40 | 2/2 | 1,230 | 114 | $2,385 | |
| 407 | $2,380,000 | -4.42% | 48 | 2/2 | 1,230 | 114 | $2,385 |
| 1414/1415 | $2,799,000 | -6.67% | 40 | 2/2 | 1,640 | 152 | $3,235 |
| 634/635 | $3,100,000 | 21 | 2/2 | 1,640 | 152 | $3,610 | |
| 415 | $3,690,000 | 52 | 2/2 | 880 | 82 | $3,555 |
| # of Units | Avg Price | Avg $/SQFT | Lowest Sale Price | Highest Sale Price | Avg Days on Market |
|---|---|---|---|---|---|
| 10 | $2,420,799 | $2,026 | $1,600,000 | $3,690,000 | 340 |
Short Sale
- Foreclosure
*a blinking %change means price adjustment in the past 20 days.
New listing
Last updated Today
3 Bedroom Condos for Sale
| Unit # | Price | %Chng | Img | Bed/Bath | Square Feet | Square m2 | Maint/$ |
|---|---|---|---|---|---|---|---|
| 526 | $1,800,000 | -7.69% | 29 | 3/2 | 1,180 | 110 | $3,400 |
| 1523-24 | $2,900,000 | 3.57% | 26 | 3/3 | 1,560 | 145 | $3,456 |
| 1432 | $3,990,000 | 40 | 3/3 | 2,480 | 230 | $5,847 |
| # of Units | Avg Price | Avg $/SQFT | Lowest Sale Price | Highest Sale Price | Avg Days on Market |
|---|---|---|---|---|---|
| 3 | $2,896,667 | $1,664 | $1,800,000 | $3,990,000 | 115 |
Short Sale
- Foreclosure
*a blinking %change means price adjustment in the past 20 days.
New listing
Last updated Today
Roney Palace Condos For Rent
Roney Palace Recent Sales
Roney Palace Recent Rentals
Corey Schwartz | Broker Associate | Gravity Real Estate
Gravity Real Estate is an independent real estate brokerage servicing the South Florida real estate community
![]()
![]()
![]()
![]()
![]()