Aston Martin Residences
300 Biscayne Blvd. Way Miami, FL 33131
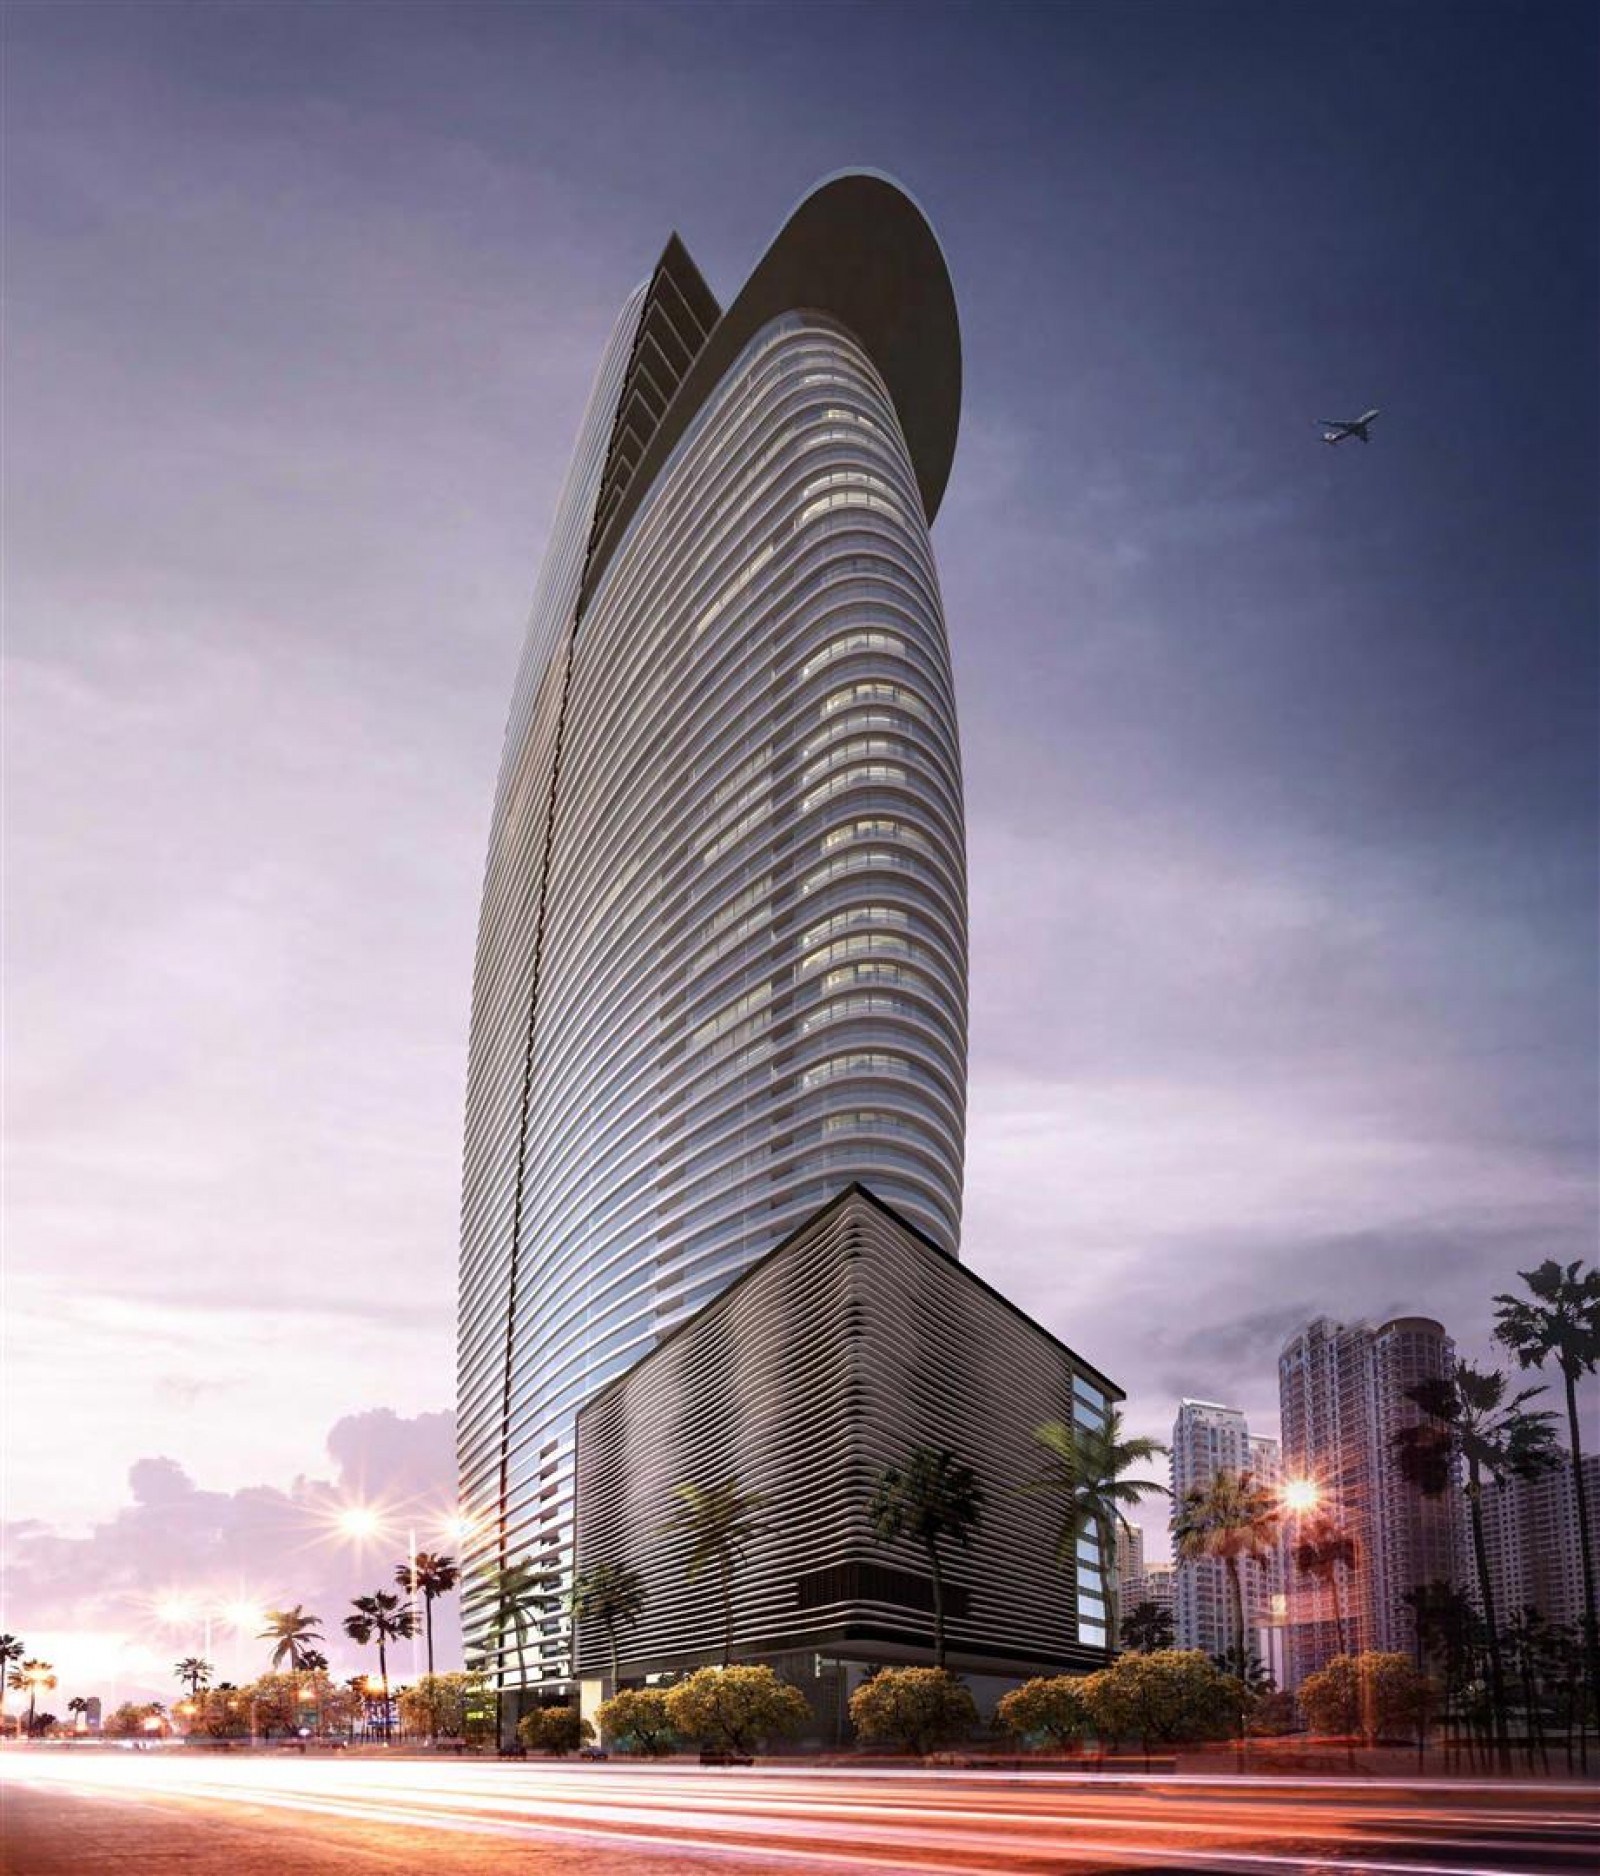
Year Built
2021
Bedrooms
0 to 7
Square Ft. Range*
618 to 19,868
No. of Floors
66
No. of Units
391
Price Range*
$875,000 to $75,000,000
Available Units*
35
Avg $/Square Ft.*
$1,757
Average Price*
$6,533,087
Average DOM*
283
*Last Updated : 06/27/2026
Alerts on new Listings
Subscribe to new listing alerts and get a daily emails. On New Sales & Rentals
Aston Martin Residences Condos For Sale
Studios Bedroom Condos for Sale
| Unit # | Price | %Chng | Img | Bed/Bath | Square Feet | Square m2 | Maint/$ |
|---|---|---|---|---|---|---|---|
| 505C | $875,000 | 58 | 0/1 | 618 | 57 | $1,200 | |
| 805 | $895,060 | -10.04% | 13 | 0/1 | 618 | 57 | $1,152 |
| # of Units | Avg Price | Avg $/SQFT | Lowest Sale Price | Highest Sale Price | Avg Days on Market |
|---|---|---|---|---|---|
| 2 | $885,030 | $1,432 | $875,000 | $895,060 | 98 |
 Short Sale
 - Foreclosure
*a blinking %change means price adjustment in the past 20 days.
New listing
Last updated Today
- Foreclosure
*a blinking %change means price adjustment in the past 20 days.
New listing
Last updated Today
1 Bedroom Condos for Sale
| Unit # | Price | %Chng | Img | Bed/Bath | Square Feet | Square m2 | Maint/$ |
|---|---|---|---|---|---|---|---|
| 506E | $1,049,000 | 35 | 1/1 | 760 | 71 | $1,476 | |
| 2308 | $1,425,000 | 24 | 1/1 | 767 | 71 | $1,266 | |
| 2608 | $1,450,000 | -3.27% | 46 | 1/1 | 0 | 0 | $1,266 |
| # of Units | Avg Price | Avg $/SQFT | Lowest Sale Price | Highest Sale Price | Avg Days on Market |
|---|---|---|---|---|---|
| 3 | $1,308,000 | $1,079 | $1,049,000 | $1,450,000 | 377 |
Short Sale
- Foreclosure
*a blinking %change means price adjustment in the past 20 days.
New listing
Last updated Today
2 Bedroom Condos for Sale
| Unit # | Price | %Chng | Img | Bed/Bath | Square Feet | Square m2 | Maint/$ |
|---|---|---|---|---|---|---|---|
| 2009 | $1,750,000 | -5.41% | 59 | 2/2 | 1,578 | 147 | $2,879 |
| 2505 | $2,350,000 | -5.05% | 75 | 2/3 | 1,699 | 158 | $2,894 |
| 5209 | $2,490,000 | -9.45% | 42 | 2/2 | 1,359 | 126 | $2,313 |
| 1102 | $2,495,000 | 37 | 2/3 | 1,474 | 137 | $2,509 | |
| 902 | $2,500,000 | -3.66% | 31 | 2/3 | 1,474 | 137 | $2,509 |
| 503C | $2,645,000 | 64 | 2/3 | 1,675 | 156 | $3,253 | |
| 903 | $2,700,000 | -9.85% | 84 | 2/3 | 1,829 | 170 | $3,150 |
| 1003 | $2,950,000 | -13.24% | 31 | 2/3 | 1,675 | 156 | $3,253 |
| 1002 | $2,980,000 | 15 | 2/3 | 1,474 | 137 | $2,509 | |
| 1103 | $3,000,000 | 47 | 2/3 | 1,829 | 170 | $3,123 | |
| 1605 | $3,150,000 | 5% | 38 | 2/3 | 1,699 | 158 | $2,893 |
| 5205W | $3,200,000 | -15.79% | 40 | 2/3 | 1,699 | 158 | $2,893 |
| 703 | $3,325,000 | 27 | 2/3 | 1,829 | 170 | $3,150 |
| # of Units | Avg Price | Avg $/SQFT | Lowest Sale Price | Highest Sale Price | Avg Days on Market |
|---|---|---|---|---|---|
| 13 | $2,733,462 | $1,673 | $1,750,000 | $3,325,000 | 296 |
Short Sale
- Foreclosure
*a blinking %change means price adjustment in the past 20 days.
New listing
Last updated Today
3 Bedroom Condos for Sale
| Unit # | Price | %Chng | Img | Bed/Bath | Square Feet | Square m2 | Maint/$ |
|---|---|---|---|---|---|---|---|
| 3407 | $3,250,000 | -7.14% | 34 | 3/3 | 0 | 0 | $3,550 |
| 2802 | $3,590,000 | 5 | 3/3 | 2,220 | 206 | $4,311 | |
| 2102 | $3,695,000 | 80 | 3/3 | 0 | 0 | $4,139 | |
| 4707 | $3,950,000 | 21 | 3/3 | 2,350 | 218 | $2,400 | |
| 3503C | $4,190,000 | 88 | 3/4 | 2,742 | 255 | $5,112 | |
| 4303 | $4,899,000 | -7.55% | 68 | 3/4 | 3,078 | 286 | $5,112 |
| 3403 | $4,990,000 | 82 | 3/4 | 3,078 | 286 | $5,112 | |
| 4703 | $5,250,000 | -8.7% | 99 | 3/4 | 3,373 | 313 | $5,011 |
| 4604 | $6,550,000 | -4.52% | 64 | 3/5 | 3,536 | 328 | $5,993 |
| # of Units | Avg Price | Avg $/SQFT | Lowest Sale Price | Highest Sale Price | Avg Days on Market |
|---|---|---|---|---|---|
| 9 | $4,484,889 | $1,272 | $3,250,000 | $6,550,000 | 300 |
Short Sale
- Foreclosure
*a blinking %change means price adjustment in the past 20 days.
New listing
Last updated Today
4 Bedroom Condos for Sale
| Unit # | Price | %Chng | Img | Bed/Bath | Square Feet | Square m2 | Maint/$ |
|---|---|---|---|---|---|---|---|
| 1704 | $4,950,000 | 45 | 4/5 | 3,225 | 300 | $6,013 | |
| 1904C | $5,095,000 | 48 | 4/5 | 3,536 | 328 | $5,993 | |
| 3404 | $5,195,000 | 64 | 4/5 | 3,214 | 299 | $6,242 | |
| 3704C | $5,550,000 | -6.72% | 54 | 4/5 | 3,214 | 299 | $6,000 |
| 3104 | $6,330,000 | 100 | 4/5 | 3,536 | 328 | $6,000 | |
| 4901E | $6,500,000 | -18.75% | 44 | 4/6 | 3,375 | 314 | $6,300 |
| # of Units | Avg Price | Avg $/SQFT | Lowest Sale Price | Highest Sale Price | Avg Days on Market |
|---|---|---|---|---|---|
| 6 | $5,603,333 | $1,673 | $4,950,000 | $6,500,000 | 160 |
Short Sale
- Foreclosure
*a blinking %change means price adjustment in the past 20 days.
New listing
Last updated Today
5 Bedroom Condos for Sale
| Unit # | Price | %Chng | Img | Bed/Bath | Square Feet | Square m2 | Maint/$ |
|---|---|---|---|---|---|---|---|
| 1901 | $6,750,000 | -2.88% | 57 | 5/5 | 3,560 | 331 | $6,638 |
| 3201 | $7,590,000 | -13.05% | 40 | 5/5 | 3,994 | 371 | $6,852 |
| 4602 | $9,000,000 | -10% | 37 | 5/5 | 4,434 | 412 | $7,900 |
| PH6001 | $23,500,000 | -17.83% | 100 | 5/6 | 9,063 | 842 | $16,473 |
| # of Units | Avg Price | Avg $/SQFT | Lowest Sale Price | Highest Sale Price | Avg Days on Market |
|---|---|---|---|---|---|
| 4 | $11,710,000 | $2,105 | $6,750,000 | $23,500,000 | 316 |
Short Sale
- Foreclosure
*a blinking %change means price adjustment in the past 20 days.
New listing
Last updated Today
7 Bedroom Condos for Sale
| Unit # | Price | %Chng | Img | Bed/Bath | Square Feet | Square m2 | Maint/$ |
|---|---|---|---|---|---|---|---|
| 6301 | $75,000,000 | 27.12% | 38 | 7/10 | 19,868 | 1,846 | $37,937 |
| # of Units | Avg Price | Avg $/SQFT | Lowest Sale Price | Highest Sale Price | Avg Days on Market |
|---|---|---|---|---|---|
| 1 | $75,000,000 | $3,775 | $75,000,000 | $75,000,000 | 653 |
Short Sale
- Foreclosure
*a blinking %change means price adjustment in the past 20 days.
New listing
Last updated Today
Aston Martin Residences Condos For Rent
Aston Martin Residences Recent Sales
Aston Martin Residences Recent Rentals
Corey Schwartz | Broker Associate | Gravity Real Estate
Gravity Real Estate is an independent real estate brokerage servicing the South Florida real estate community
![]()
![]()
![]()
![]()
![]()