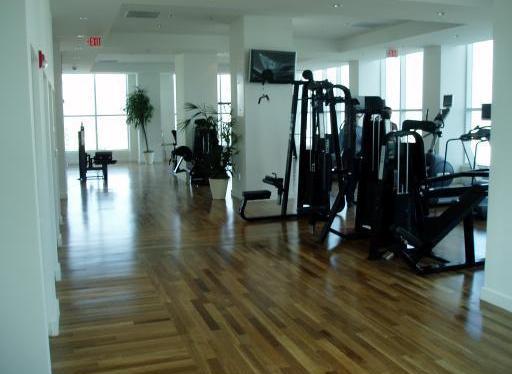
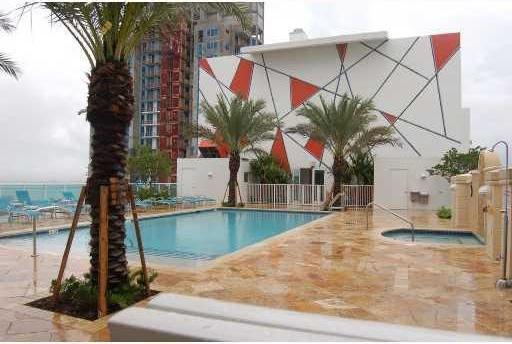
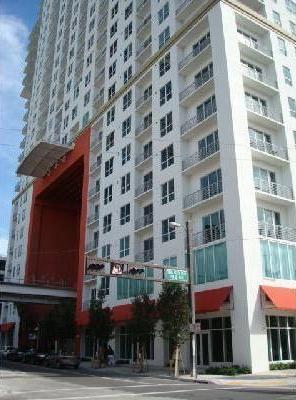
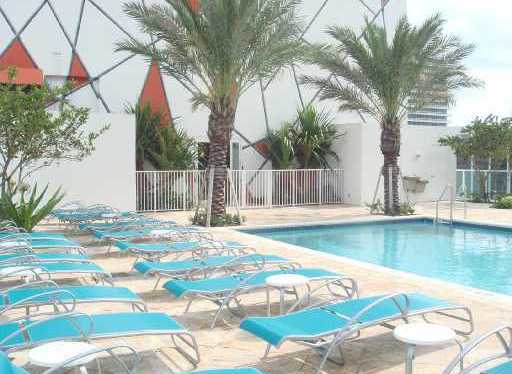
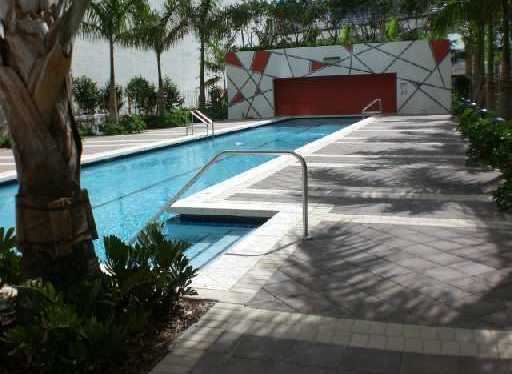
Loft Downtown II
133 2 Ave Downtown Miami, FL 33128


Year Built
2007
Bedrooms
1 to 2
Square Ft. Range*
620 to 1,153
No. of Floors
36
No. of Units
498
Price Range*
$259,999 to $529,000
Available Units*
18
Avg $/Square Ft.*
$445
Average Price*
$399,527
Average DOM*
74
*Last Updated : 07/02/2026
Alerts on new Listings
Subscribe to new listing alerts and get a daily emails. On New Sales & Rentals
Loft Downtown II Condos For Sale
1 Bedroom Condos for Sale
| Unit # | Price | %Chng | Img | Bed/Bath | Square Feet | Square m2 | Maint/$ |
|---|---|---|---|---|---|---|---|
| 909 | $259,999 | -6.81% | 22 | 1/1 | 662 | 61 | $619 |
| 1209 | $299,000 | -6.53% | 23 | 1/1 | 662 | 61 | $659 |
| 209 | $315,000 | 17 | 1/1 | 770 | 72 | $765 | |
| 2107 | $330,000 | 12 | 1/1 | 651 | 60 | $542 | |
| 1408 | $350,000 | 20 | 1/1 | 903 | 84 | $896 | |
| 2108 | $360,000 | 4.35% | 5 | 1/1 | 903 | 84 | $650 |
| 3410 | $368,998 | -4.16% | 23 | 1/1 | 620 | 58 | $490 |
| 1608 | $392,500 | -6.55% | 55 | 1/1 | 903 | 84 | $843 |
| 801 | $395,000 | 14 | 1/1 | 950 | 88 | $942 | |
| 1208 | $400,000 | 27 | 1/1 | 903 | 84 | $842 | |
| 2508 | $418,000 | 6 | 1/1 | 903 | 84 | $896 |
| # of Units | Avg Price | Avg $/SQFT | Lowest Sale Price | Highest Sale Price | Avg Days on Market |
|---|---|---|---|---|---|
| 11 | $353,500 | $445 | $259,999 | $418,000 | 86 |
 Short Sale
 - Foreclosure
*a blinking %change means price adjustment in the past 20 days.
New listing
Last updated Today
- Foreclosure
*a blinking %change means price adjustment in the past 20 days.
New listing
Last updated Today
2 Bedroom Condos for Sale
| Unit # | Price | %Chng | Img | Bed/Bath | Square Feet | Square m2 | Maint/$ |
|---|---|---|---|---|---|---|---|
| 913 | $410,000 | 11 | 2/2 | 1,153 | 107 | $966 | |
| 1013 | $450,000 | -3.23% | 22 | 2/2 | 1,153 | 107 | $1,145 |
| 1512 | $465,000 | -0.85% | 37 | 2/2 | 1,036 | 96 | $965 |
| 1112 | $465,000 | 25 | 2/2 | 1,036 | 96 | $945 | |
| 912 | $469,000 | 13 | 2/2 | 1,036 | 96 | $966 | |
| 1606 | $515,000 | -1.9% | 33 | 2/2 | 1,010 | 94 | $941 |
| 2302 | $529,000 | 33 | 2/2 | 1,041 | 97 | $905 |
| # of Units | Avg Price | Avg $/SQFT | Lowest Sale Price | Highest Sale Price | Avg Days on Market |
|---|---|---|---|---|---|
| 7 | $471,857 | $445 | $410,000 | $529,000 | 54 |
Short Sale
- Foreclosure
*a blinking %change means price adjustment in the past 20 days.
New listing
Last updated Today
Loft Downtown II Condos For Rent
Loft Downtown II Recent Sales
Loft Downtown II Recent Rentals
Corey Schwartz | Broker Associate | Gravity Real Estate
Gravity Real Estate is an independent real estate brokerage servicing the South Florida real estate community
![]()
![]()
![]()
![]()
![]()